Grafana
DepC provides two templates to bootstrap Grafana dashboards with information concerning your QoS.
Installation
Warning
You have to be manager of your team to use this feature.
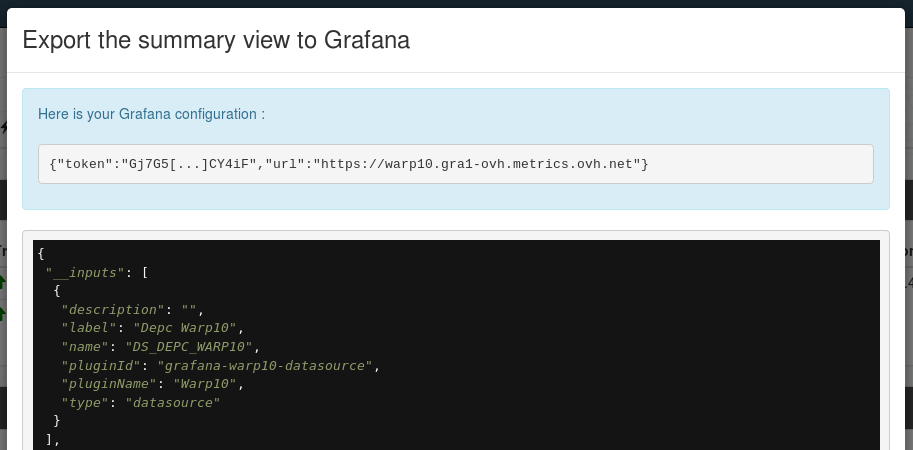
You must create the DepC source in your Grafana instance using the direct
access.
You must also create the token constant containing your read-only token.
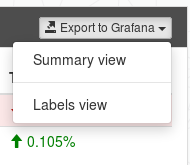
You can display it when you open a view throught the Export to Grafana
button available in your DepC homepage :
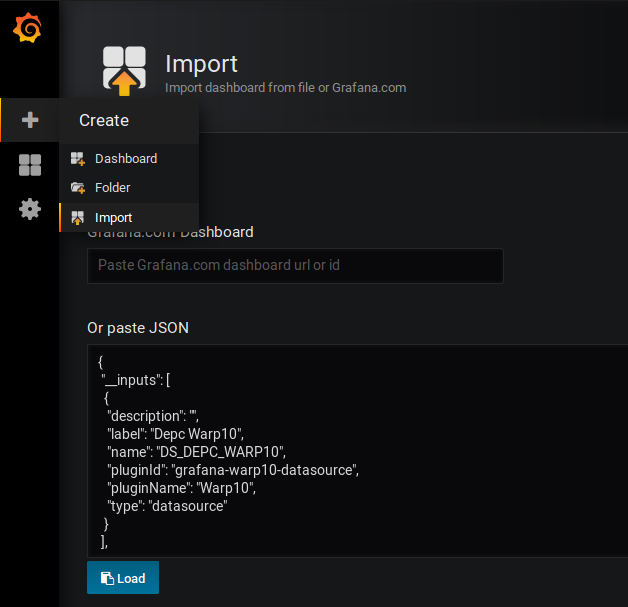
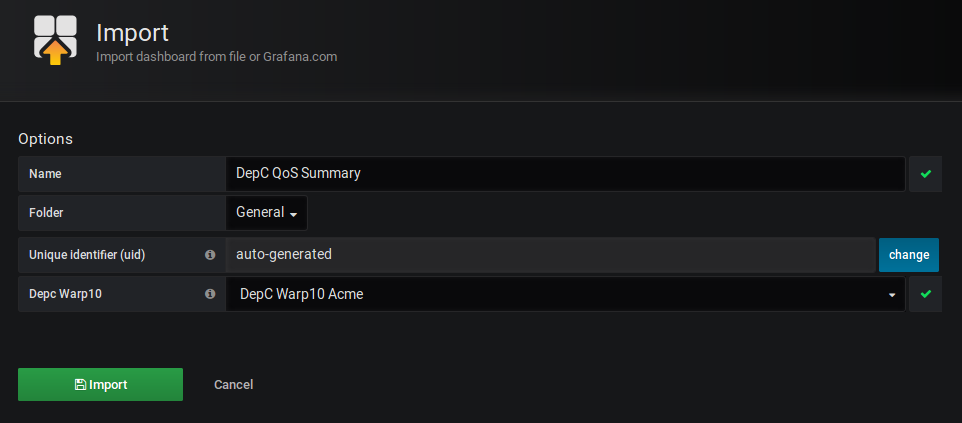
You can now copy the JSON of your wanted view (repeat the following operation for each view) and paste it in Grafana using the Import menu :
Note
We only provide Warp10 export for now.
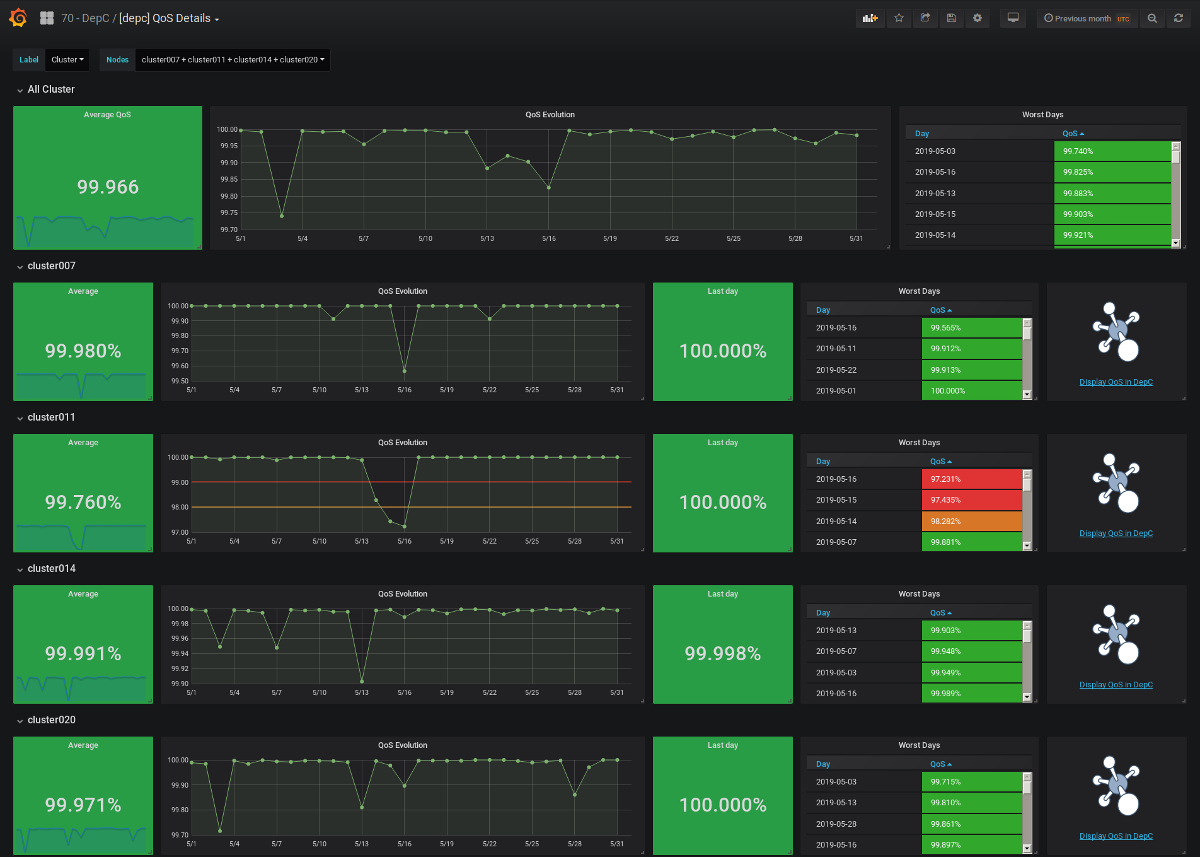
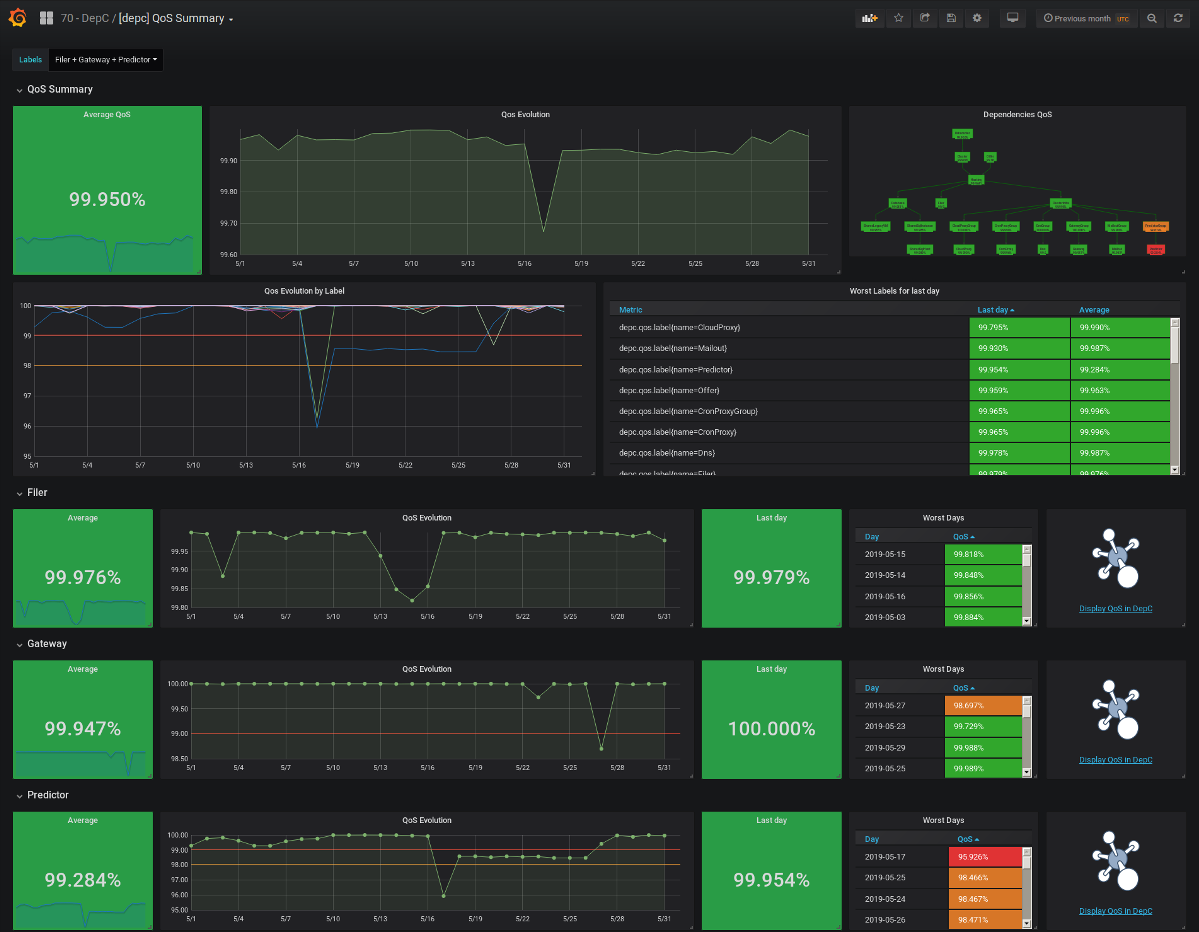
Summary view
This dashboard displays your average QoS and the evolution of each label. You can also quickly view the worst days by label.
Details view
You can use this dashboard to display the evolution of a specific node, filtering it by label and by name.