Tutorial
Note
The goal of this tutorial is to show you the main usage of DepC : manage your dependencies and compute their QOS.
We are member of the ACME team. Our role is to host the websites of our customers. So we manage the storage of their files and some web servers.
We split our nodes into four different categories : Offer, Webhosting, Filer and Apache. In DepC a category is called a label (this term comes directly from the Neo4J terminology).
The relationships between our labels are represented with the following graph :
Most actions in DepC are done within a team, so you must already be part of one or multiple teams to play with DepC. A user can be a member, an editor or a manager of a team.
Only DepC administrators can create new teams for now, so please ask your admin to do it.
Step 1 : Push your Dependencies
DepC uses Kafka to manage your dependencies inside the Neo4j database, so you need to push messages inside your own topic.
Note
The format of the Kafka messages is defined in this dedicated guide, please read it to know the required and optionals keys.
We are going to create 7 nodes and their relationships : 2 Website, 2 Filer, 2 Apache and 1 Offer. We’ll use this simple Python script to easily send our message in the Kafka topic, but of course you can use your own library / language :
import json
import os
import ssl

from kafka import KafkaProducer

conf = {
    'bootstrap_servers': os.getenv('DEPC_KAFKA_HOST'),
    'security_protocol': 'SASL_SSL',
    'sasl_mechanism': 'PLAIN',
    'sasl_plain_username': os.getenv('DEPC_KAFKA_USERNAME'),
    'sasl_plain_password': os.getenv('DEPC_KAFKA_PASSWORD'),
    'ssl_context': ssl.SSLContext(ssl.PROTOCOL_SSLv23),
    'ssl_check_hostname': False,
    'client_id': os.getenv('DEPC_KAFKA_TOPIC'),
    'value_serializer': lambda v: json.dumps(v).encode('utf-8')
}
p = KafkaProducer(**conf)

messages = [
    # Nodes for the Premium offer
    {'source': {'label': 'Offer', 'name': 'premium'}, 'target': {'label': 'Website', 'name': 'foo.com'}},
    {'source': {'label': 'Offer', 'name': 'premium'}, 'target': {'label': 'Website', 'name': 'bar.com'}},
    # Nodes for foo.com
    {'source': {'label': 'Website', 'name': 'foo.com'}, 'target': {'label': 'Filer', 'name': 'filer1'}},
    {'source': {'label': 'Website', 'name': 'foo.com'}, 'target': {'label': 'Apache', 'name': 'apache1'}},
    # Nodes for bar.com
    {'source': {'label': 'Website', 'name': 'bar.com'}, 'target': {'label': 'Filer', 'name': 'filer2'}},
    {'source': {'label': 'Website', 'name': 'bar.com'}, 'target': {'label': 'Apache', 'name': 'apache2'}}
]

for m in messages:
    p.send(os.getenv('DEPC_KAFKA_TOPIC'), m)
p.flush()
After executing it (don’t forget to set your environment variables), you can use Dependencies tab to explore your nodes :
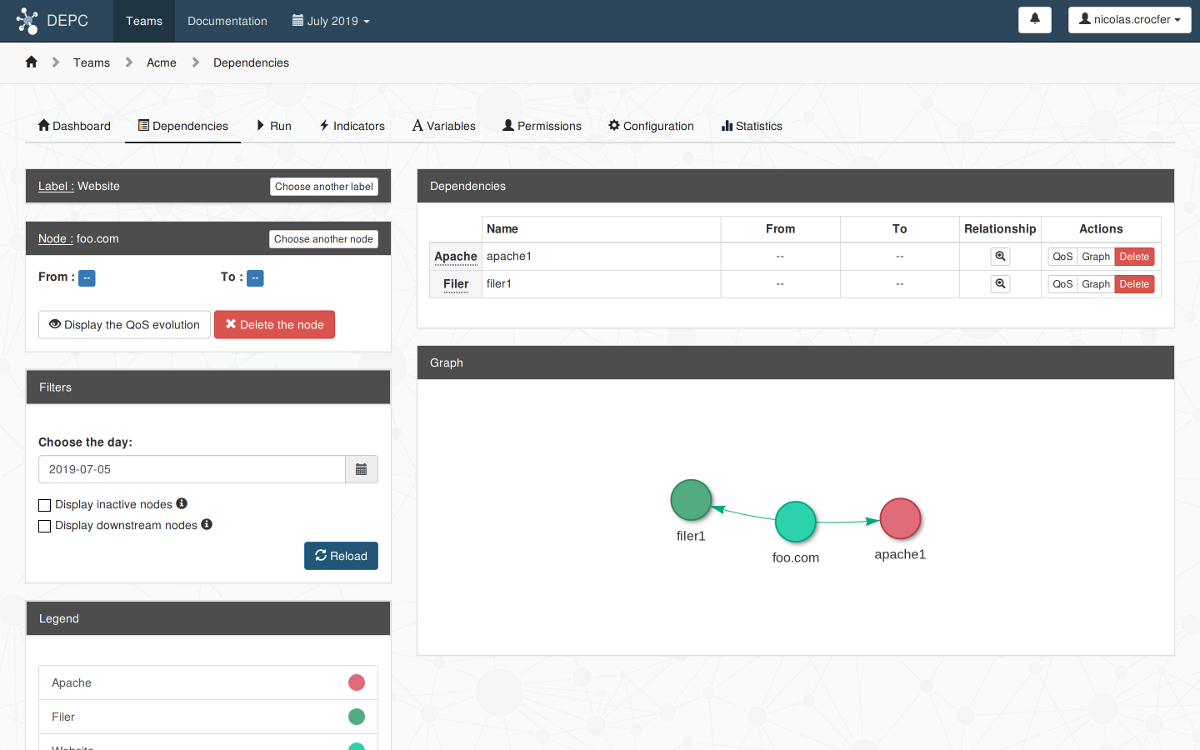
Note
You can remove the nodes and their relationships with the Delete node button when you’re done with this tutorial.
Step 2 : Compute your QOS
The Apache and Filer nodes represent some servers in real life. In this case we can analyse data in TimeSeries databases, populated by some probes.
Create the Source
The first step is to declare a Source : it’s basically an URL and a token used to communicate with the Timeseries database.
DepC only supports OpenTSDB and Warp10 databases for now. In this tutorial we’ll use a third type of database : the Fake one, specifically created for the purpose of this tutorial. This source generates data on the fly, so you can test DepC without having real probes sending datapoints into a TimeSeries database.
Go to the Indicators tab and click on the “New source” button to create it:
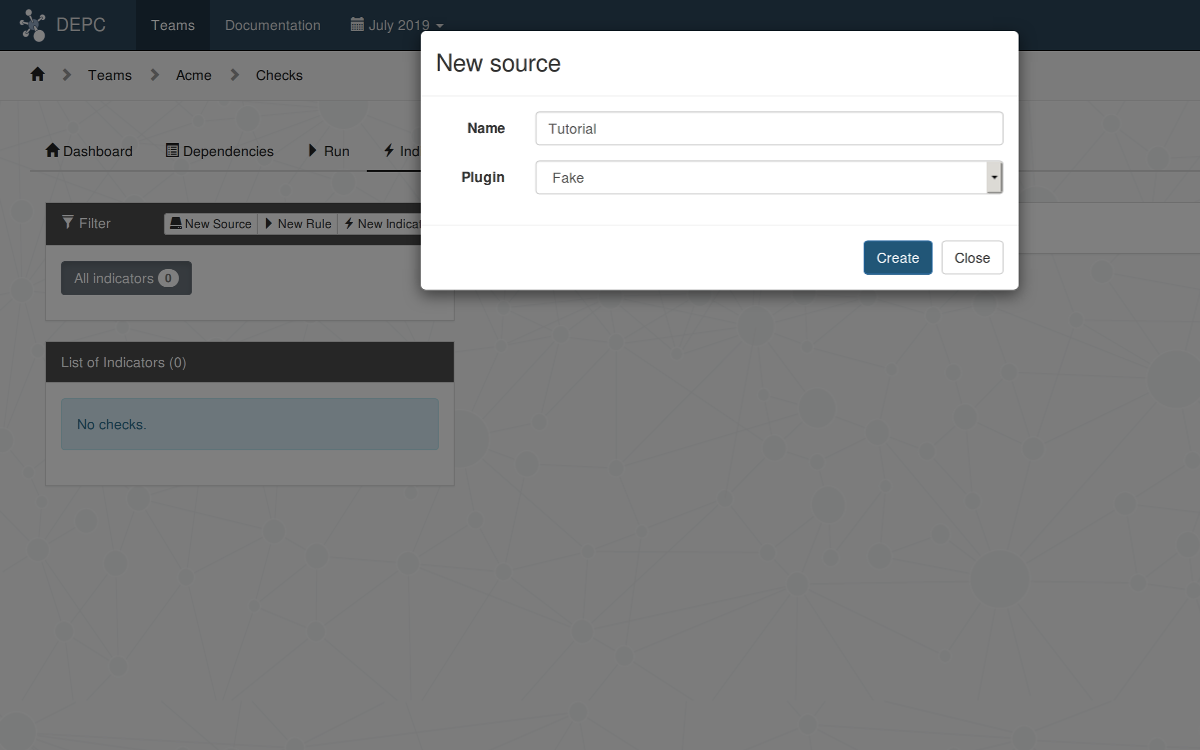
Note
Please note you don’t have to add extra parameters, like the url of the source or a read-only token, but it will be the case for the OpenTSDB and Warp10 sources.
Create the Indicators
An indicator is a Python function that queries a source, retrieves the datapoints and uses it to compute a QoS percentage. Please read the dedicated guide for more information about the indicators.
Thanks to the Fake source we already have access to the depc.tutorial.ping metric, which represents the response time of the ping command launched every minute.
Click on the “New indicator” button and fill the form to create the Server Ping indicator.
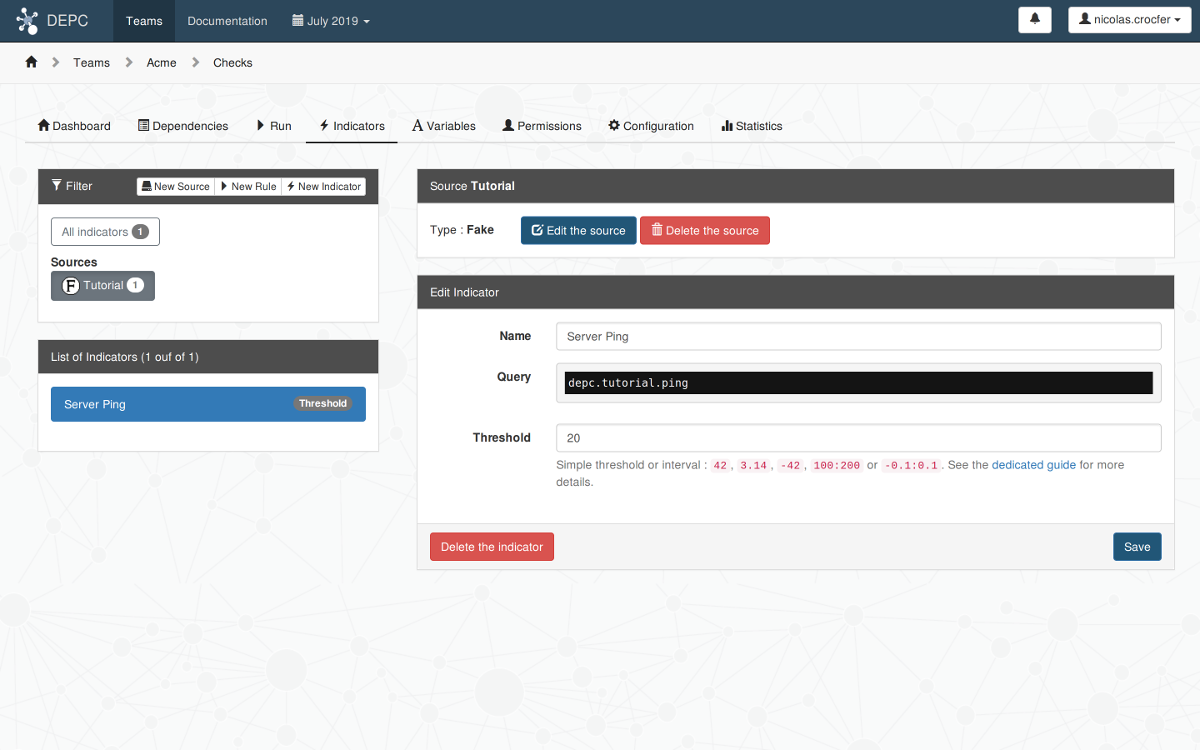
Note
Here we use the Fake source, so the query is really simple. It will be a JSON payload for the OpenTSDB source, and a warpscript for the Warp10 source.
Create the Rule
A rule is a group of indicators (an indicator can be added in multiple rules). We are going to create the Servers rule which will contain our Server Ping indicator.
Click on the New rule button and create the Servers rule. Then add our indicator to it by using the Associate indicators button.
The rule is now ready and can be launched. In the Run tab, fill the name with filer1 and click on the Run button to execute the rule :
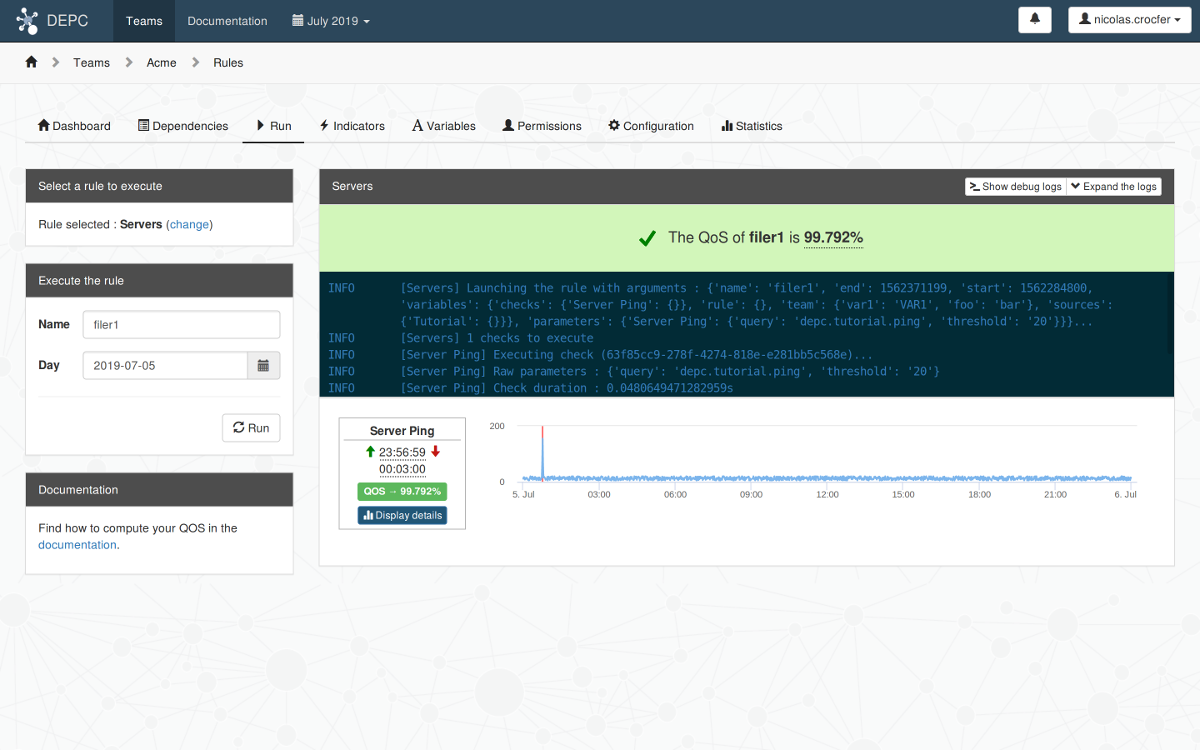
Click on the Display details button to get more information about the indicator :
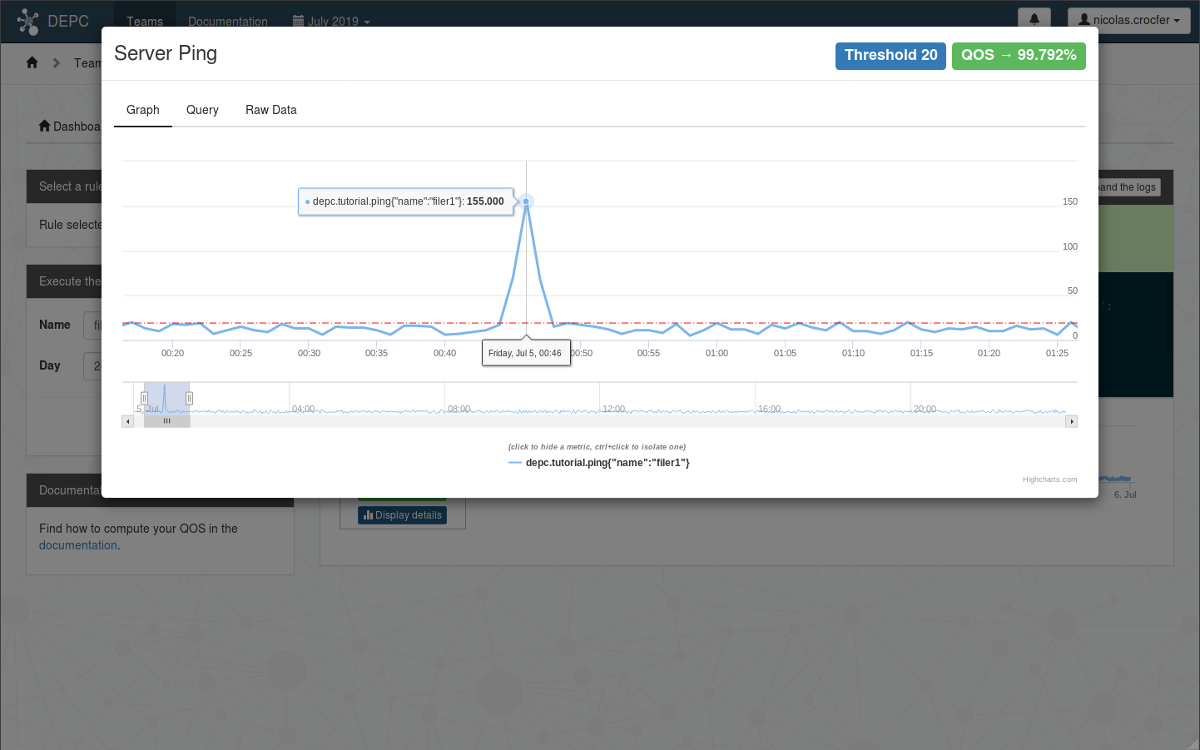
We can see that the Ping response time exceed our threshold for some time, so the QOS of filer1 decreased during this period.
Step 3 : Create the Configuration
We must now indicate to DepC how to compute the QoS for each kind of nodes. Depending on whether you have metrics to analyze or not, DepC can use 2 methods to compute the QoS of a node :
- analysing datapoints available in a TimeSeries database,
- using the QoS of its parent(s).
As a reminder the ACME team has 4 labels :
The Apache and Filer nodes will use the Servers rule. The Website and Offer nodes will use their parents QoS to compute their own one.
This information is given in the team’s configuration using this JSON representation :
{
 "Apache": {
  "qos": "rule.Servers"
 },
 "Filer": {
  "qos": "rule.Servers"
 },
 "Offer": {
  "qos": "aggregation.AVERAGE[Website]"
 },
 "Website": {
  "qos": "operation.AND[Filer, Apache]"
 }
}
Go to the Configuration tab of your team, click on the Update the configuration button and fill it with this JSON :
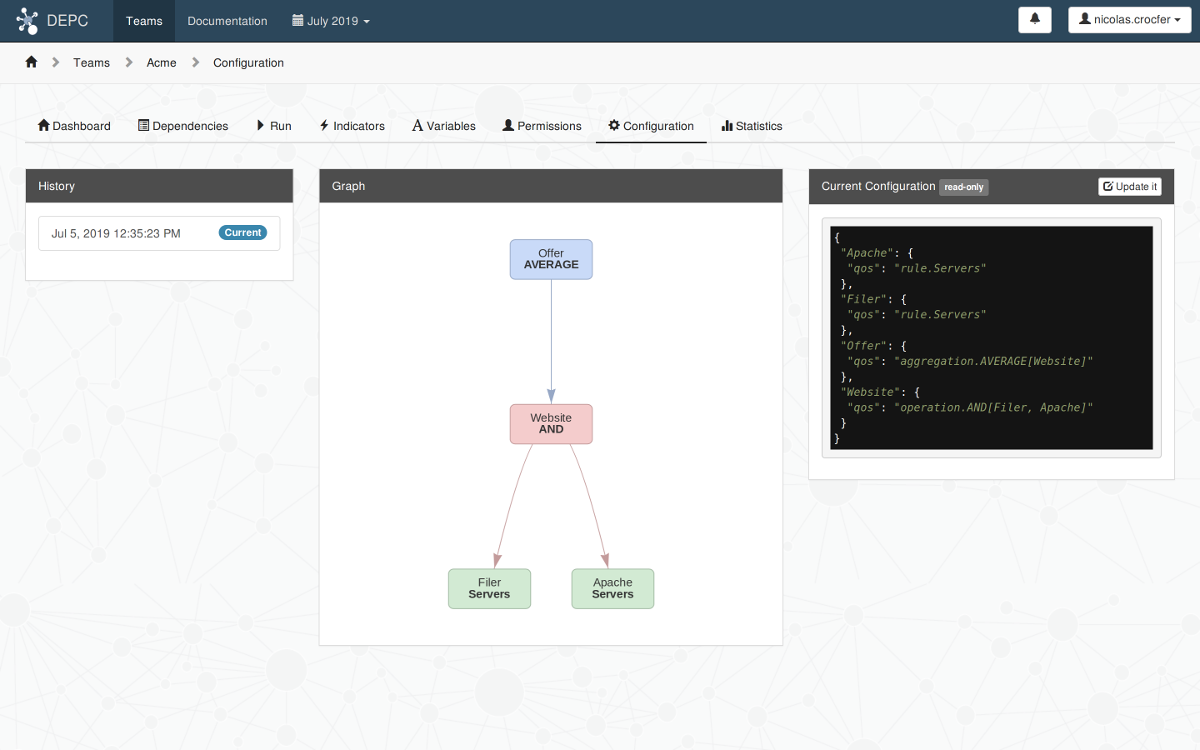
The graph represents how DepC will compute your QoS :
- First the Filer and Apache nodes QoS will be computed in parallel using the Servers rule.
- Then the QoS of the Website nodes will be computed by applying a AND operation between their parents.
- Finally DepC will compute the QoS of the Offer nodes using the average of their websites.
Note
You can find more information about the different methods to compute a QOS and their syntax in the dedicated guide.
Step 4 : Play with the Dashboard
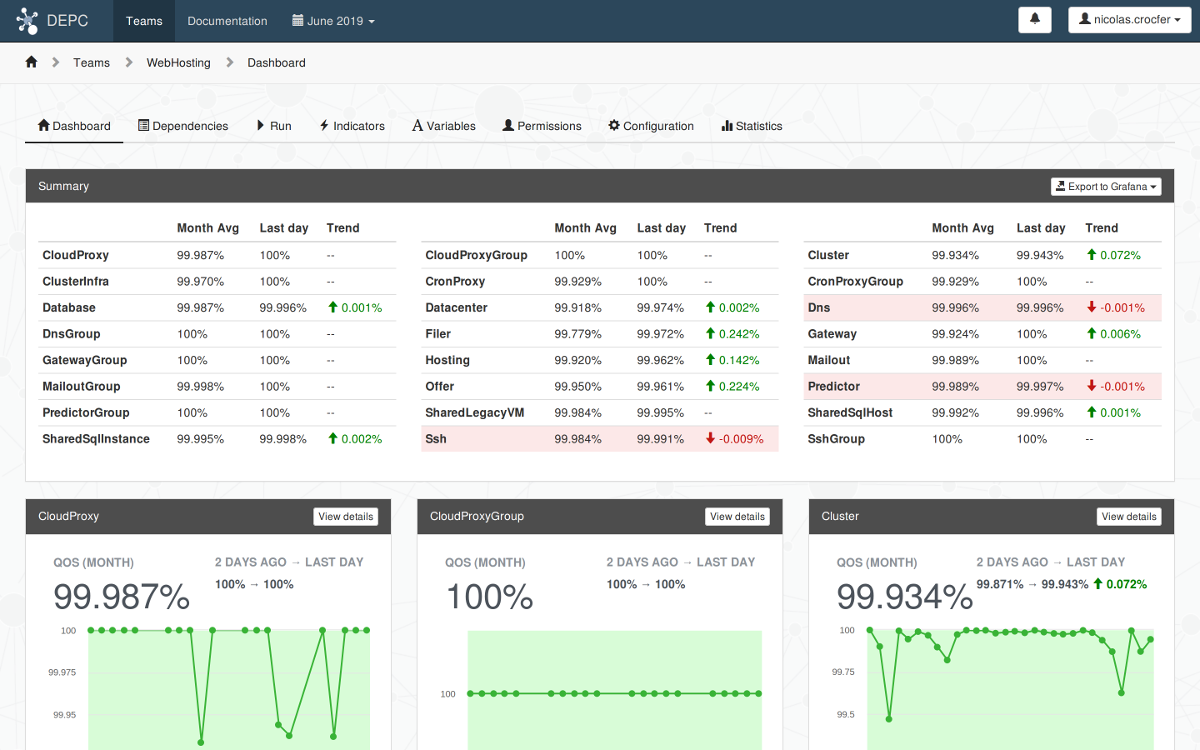
DepC computes the QoS of your nodes every nights for the day before. So you need to wait a little bit to view the result on your dashboard.
Here is a real example taken from one of our teams :
By clicking on a label, we can select a specific node and analyses its dependencies to understand where a problem comes from :
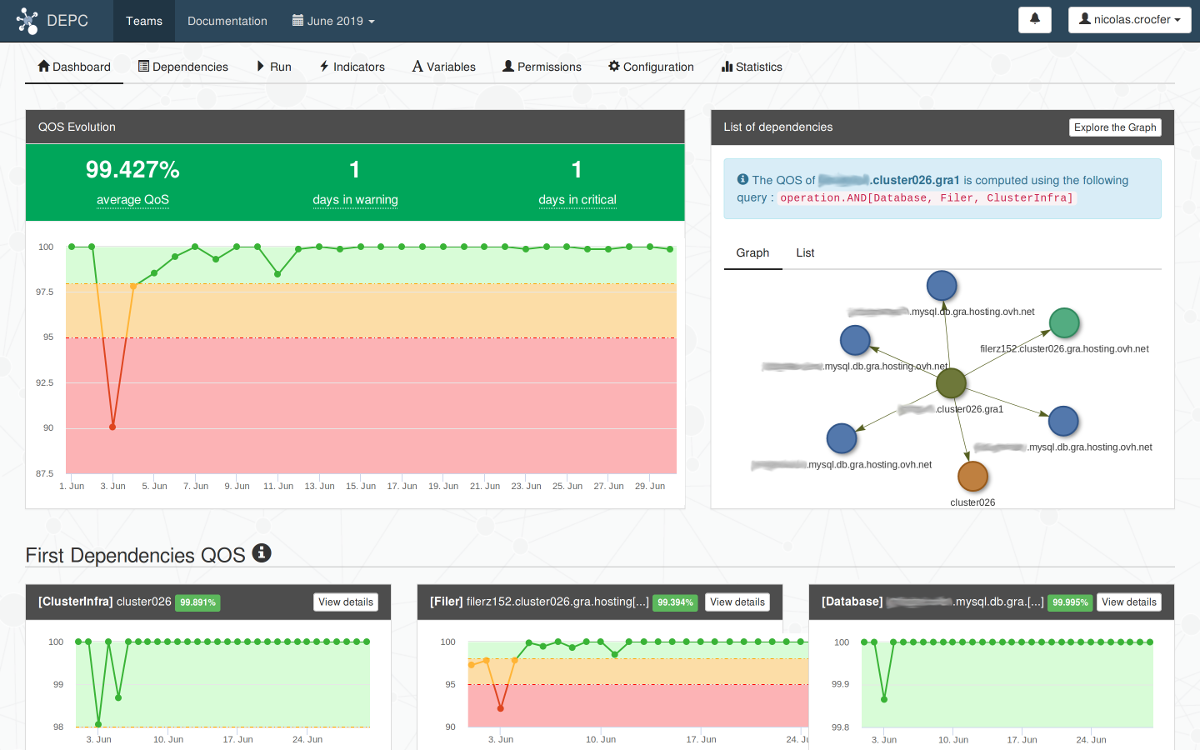
Finally we can find when occurs the problem by analysing the indicators (see step 2 of this tutorial).
Note
You can also display your QoS into Grafana following this guide.